


Modeling the Lethality of Small Attack Drones and Loitering Munitions

Abstract: This paper presents a probabilistic model to assess the lethality of small tactical strike drones, including widely used first-person view (FPV) quadcopters, and provides a basic yet flexible analytical tool for researchers and planners seeking to better understand the role of these systems in contemporary military operations. The model underpins a series of simulations examining lethality distributions in campaigns against inferior and peer adversaries, enabling the derivation of notional quantitative requirements and cost implications for low-end and high-end strike systems. The results provide an empirical basis to challenge simplistic cost-centric comparisons and mainstream assumptions about the universal effectiveness of attritable mass and to show why inexpensive FPV-type drones are ill-suited as a one-size-fits-all solution across diverse operational environments.
Introduction
In Ukraine and other conflicts, the proliferation of small strike drones of various types has given infantry units the organic capability to rapidly conduct beyond line-of-sight precision strike at scale, dramatically extending their fire control area (even up to 20-30 kilometers) and ability to threaten a variety of targets, including heavy armored units, before they can even join the fray. This development has sparked widespread debate across the North Atlantic Treaty Organization (NATO) regarding capability development and force design adaptations as many allies grapple with budgetary constraints and competing procurement priorities. For the tactical strike mission set, many observers and policymakers may indeed question the procurement of expensive military-grade loitering munitions or even new artillery pieces when they can buy exponentially larger quantities of FPV quadcopters at ~€1,000 (~$1,200) per unit for the same budget. At first glance, the argument seems compelling. The case of Ukraine has repeatedly shown that quantity has a quality of its own, even at the expense of performance.
However, the lessons emerging from the war in Ukraine are not necessarily applicable to other contexts and operational situations where the geography, mission requirements, adversary’s characteristics, and several other elements can differ and require specific capabilities and concepts of operations. A case in point underscoring this inherent complexity is the United States Marine Corps’ (USMC) recent selection of Teledyne FLIR’s Rogue-1 and Anduril’s Bolt-M loitering munitions for its Organic Precision Fires-Light (OPF-L) program.
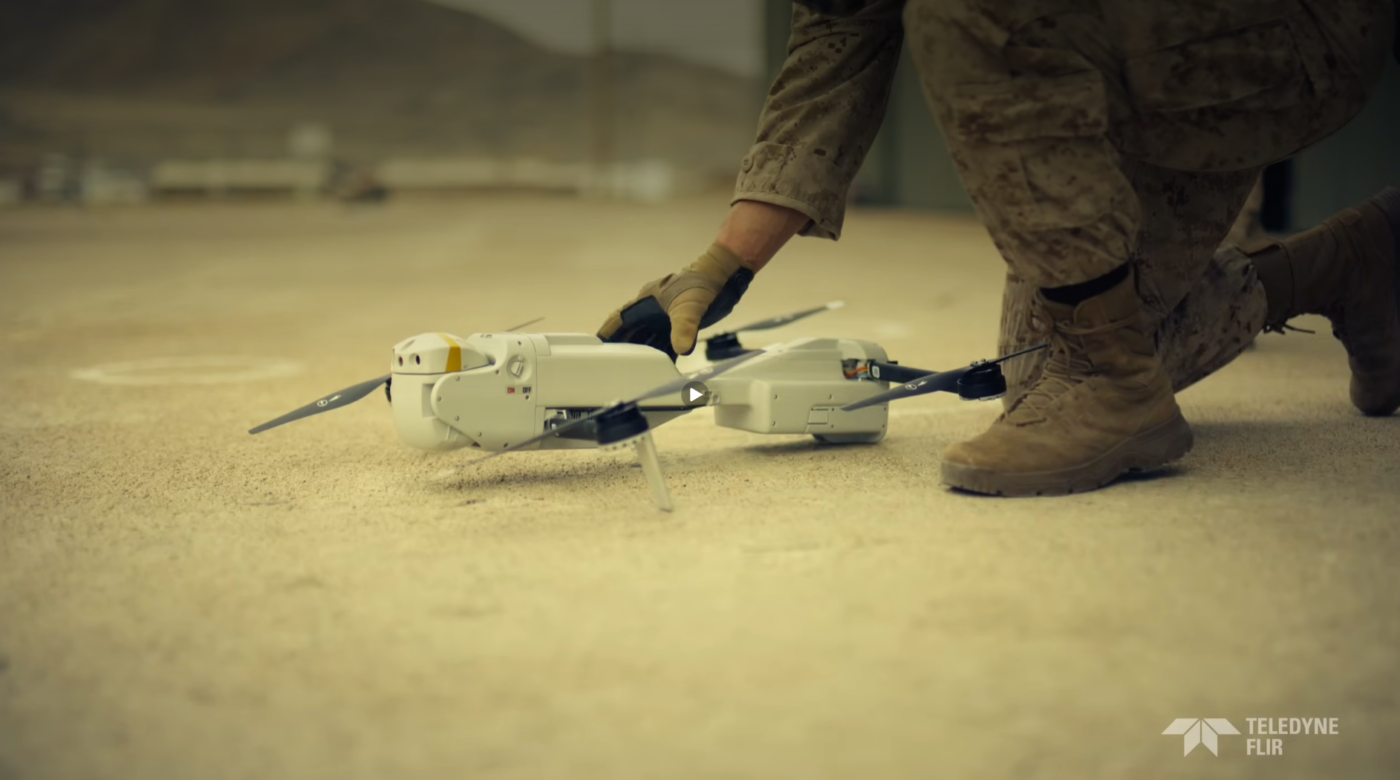
Rogue-1 loitering munition – Source: Teledyne FLIR Defense
Why did the USMC choose two systems that are much more expensive than regular FPV quadcopters? To answer this apparently simple question, it is necessary to look at the technical differences between bespoke systems, the operational context in which USMC units plan to operate, and the implications across key areas such as sustainment and logistics, among others. Indeed, price is not the only metric that informs the selection of a strike capability.
The Risks of a “One Size Fits All” Approach
FPV drones are one of the most popular and most employed weapons of the war in Ukraine. Both sides use them in the thousands every day and they – along with other drones – contribute to up to 80% of Russian targets hit, according to Ukrainian estimates. In most sectors, they have replaced artillery as the favorite tool for striking enemy targets such as personnel, vehicles, dugouts, and artillery positions at tactical depth. Operating as part of staked hunter-killer complexes alongside spotter drones, they typically roam the frontline and adjacent areas looking for targets of opportunity but can also lie in ambush waiting to wreak havoc on enemy forces.
FPV quadcopters struggle to achieve reliable effectiveness. While it is hard to draw firm conclusions due to fragmentary data, Ukrainian sources repeatedly indicate an effectiveness typically ranging between 20–50% with significant variations across units and sectors of the frontline.
Mass use and high attrition are built into their concept of operations. This reflects the current attritional and largely static configuration of the Ukrainian battlespace as both sides struggle to build and rapidly exploit superiority for a breakthrough in a sensor- and effector-saturated battlefield. In this context, regular resupply ensures an adequate magazine depth for FPV drone crews typically operating some 10-15 km behind the forward line of own troops (FLOT).
However, FPV drones have their own limitations. First, they are manpower-intensive, requiring highly skilled personnel due to their high cognitive demand. Swarming features entail additional costs and are currently available only on a few platforms. Second, the most common FPV quadcopter designs are also susceptible to environmental elements such as dust, icing, fog, or cold as well as adversarial countermeasures like electronic warfare or kinetic interception. Third, due to the zoo of systems employed and the limited pool of standardized FPV munitions, interoperability remains challenging and sustainment, reliability, safety, and lethality suffer. Fourth, they introduce low-airspace and spectrum deconfliction problems, often complicating coordination among different units and increasing the risk of fratricide.
The effects of RF jamming on the video signal of a Ukrainian FPV drone – source: Flying Skull unit, Telegram
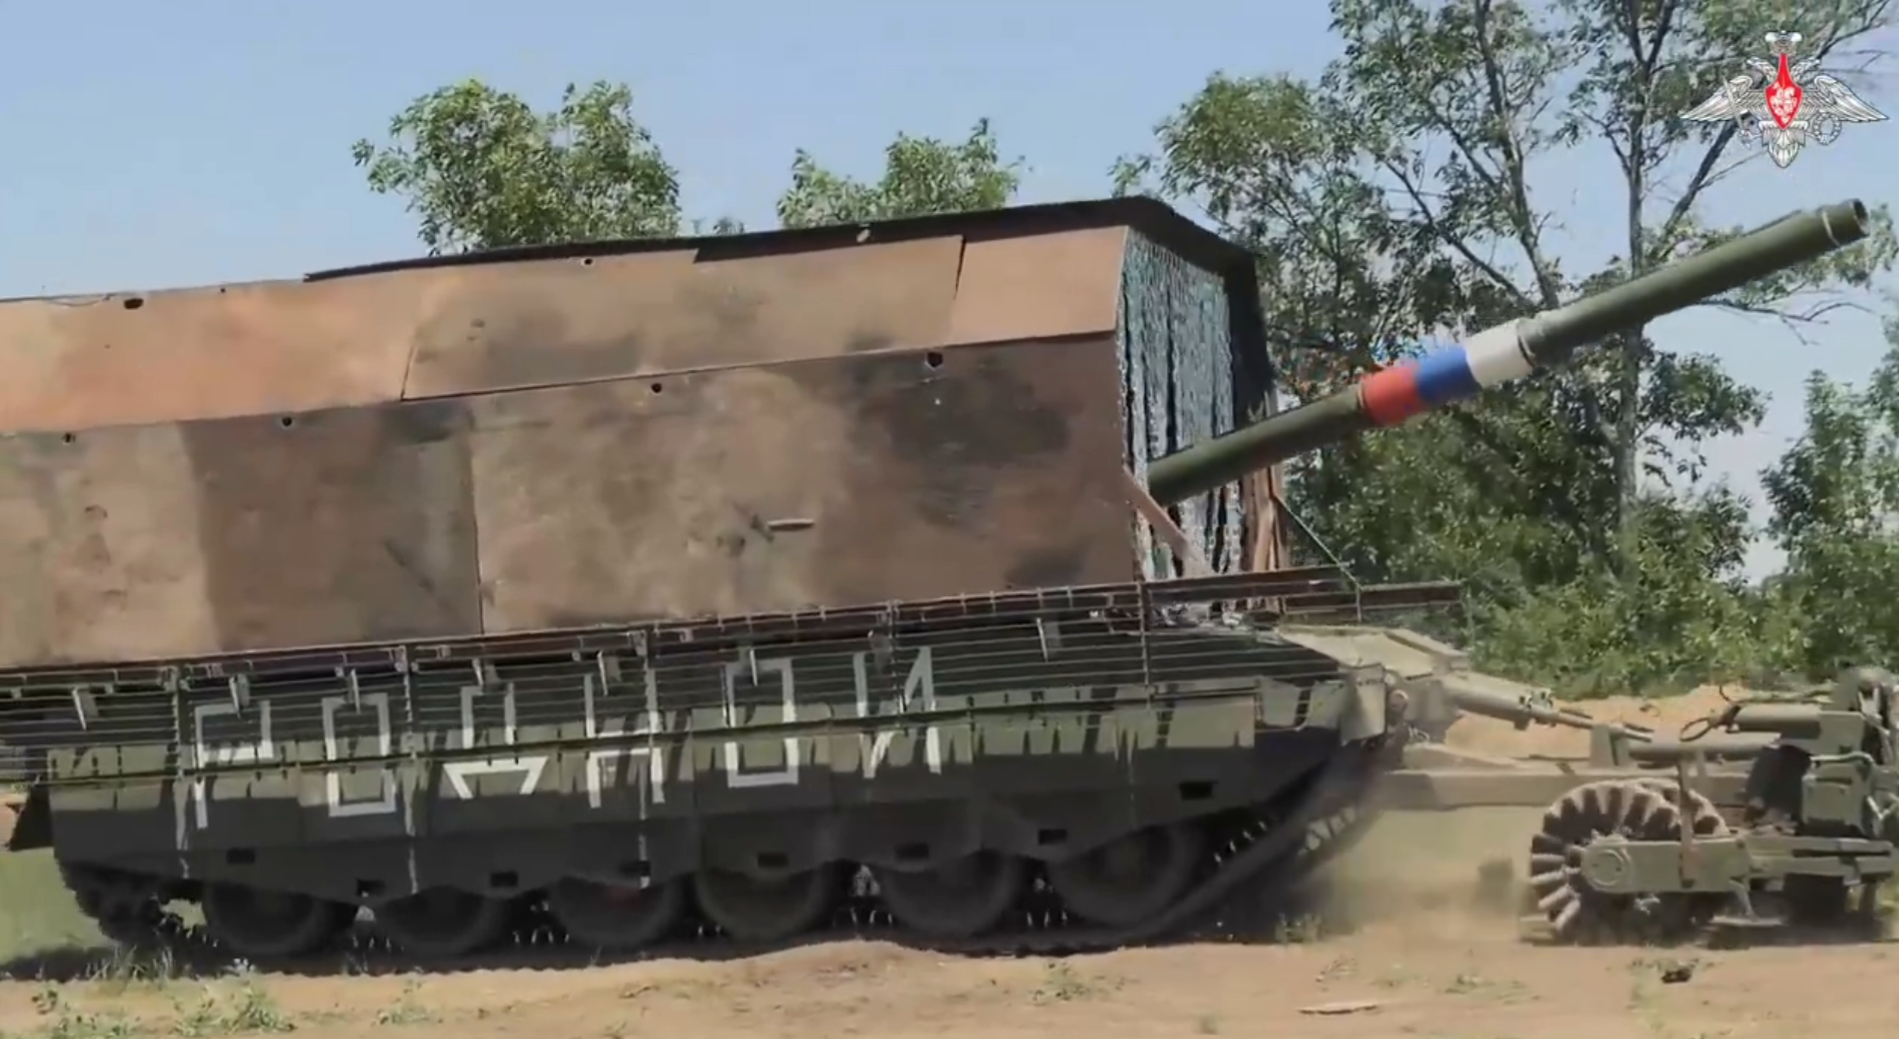
Because of these reasons, FPV quadcopters struggle to achieve reliable effectiveness. While it is hard to draw firm conclusions due to fragmentary data, Ukrainian sources repeatedly indicate an effectiveness typically ranging between 20–50% with significant variations across units and sectors of the frontline. As a result, crews must often launch multiple drones per target, especially against armored vehicles retrofitted with additional Counter-UAS (C-UAS) protections such as metal screens, rubber layers, personnel armed with shotguns, and other add-ons. According to data shown by Ukrainian special operators and seen by this author, it takes an average of 10 to 15 FPV quadcopters to disable or take out heavily modified armored fighting vehicles used by Russian forces for mechanized assaults.
Given their current reliability and lethality, most FPV quadcopter designs shine in a mass-centric land conflict characterized by positional warfare but are suboptimal for demanding operational environments and dispersed operations with contested or minimal logistics, such as those informing the Marine Corps OPF-L program.
Therefore, in the typical concept of operations (CONOP) of FPV quadcopters, mass is essential to compensate for limited or uneven lethality. The first side effect of this concept, however, is a heavier logistical burden with obvious implications for units conducting dispersed operations. Second, the typical one-pilot-one-drone configuration becomes a constraint when the number of experienced pilots is limited or training pipelines cannot catch up with battlefield needs, reducing sortie generation. These sustainment problems would worsen in contested environments where an adversary can threaten logistic elements and lines of communications.
Given their current reliability and lethality, most FPV quadcopter designs shine in a mass-centric land conflict characterized by positional warfare but are suboptimal for demanding operational environments and dispersed operations with contested or minimal logistics, such as those informing the Marine Corps OPF-L program. They are ideal for mass-centric tactics to overwhelm defenses, but impose tradeoffs in terms of reliability, lethality, and sustainment. That said, sturdier military-grade FPV quadcopter designs may mitigate bespoke limitations, but at an increased cost.
Modeling Tactical Strike UAV lethality
This analysis defines a probabilistic model of lethality to estimate the effectiveness of tactical loitering munitions against different target sets in contested and uncontested environments. We can define “lethality” as the ability of a single munition to produce a mission kill, defined as incapacitating effects, against a specified target class under given operational conditions. It is worth noting that lethality differs from simply hitting the target (hit probability), which does not necessarily cause incapacitating effects.
The model breaks lethality into a sequence of conditional probabilities corresponding to distinct and independent phases of the tactical strike drone/loitering munition targeting cycle. The lethality probability is modeled as the product of these factors, as follows:

Where:
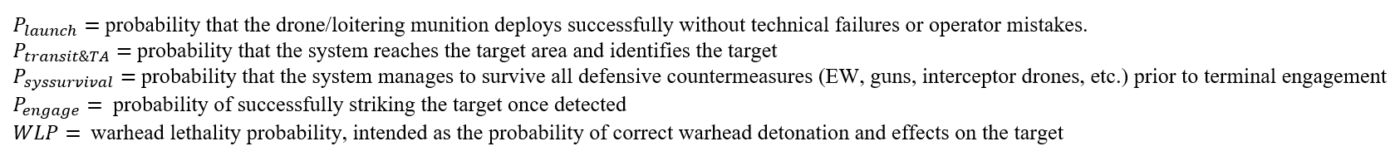 Each of the model’s factors relies on 0-1 values derived by computing the mathematical interaction between its specific inputs, which are themselves independent probabilities expressed through 0-1 values (see Annex). For example:

An illustrative computation is as follows:

While these values are notional and estimated based on author’s interviews and publicly available combat footage and information from the war in Ukraine and other conflicts, they can be both sensitivity-tested and replaced with real battlefield or test data without changing the methodology’s structure. Values need to reflect the specific systems’ capabilities, concept(s) of operations, and known performance against various targets (e.g., vehicles, personnel, etc.).
This model deliberately aggregates all active countermeasures (i.e., electronic warfare and kinetic counter-UAS effects) into a single survival term, applied once across the kill chain. [1]
While it introduces more complexity, the Warhead Lethality Probability (WLP) coefficient reflects the uncertainty related to the warhead’s detonation and effects on the target. By removing the WLP from the equation, we obtain the hit probability.
Based on the model illustrated above, it is now possible to compare the lethality of FPVs and high-end loitering munitions against protected mobility targets in both permissive and contested combat environments. The first scenario reproduces attacks against standard armored vehicles without soft or hard-kill C-UAS countermeasures. The second scenario replicates attacks against armored vehicles retrofitted with C-UAS protections and supported by both soft and hard-kill countermeasures.
More than three out of five (72%) FPV quadcopters would hit their targets, while 50% would result in a lethal strike. Four out of five loitering munitions would deliver lethal effects on armored vehicle targets in a permissive combat environment against an inferior adversary, 38% more compared to the FPV quadcopter. The hit probability would be .91.

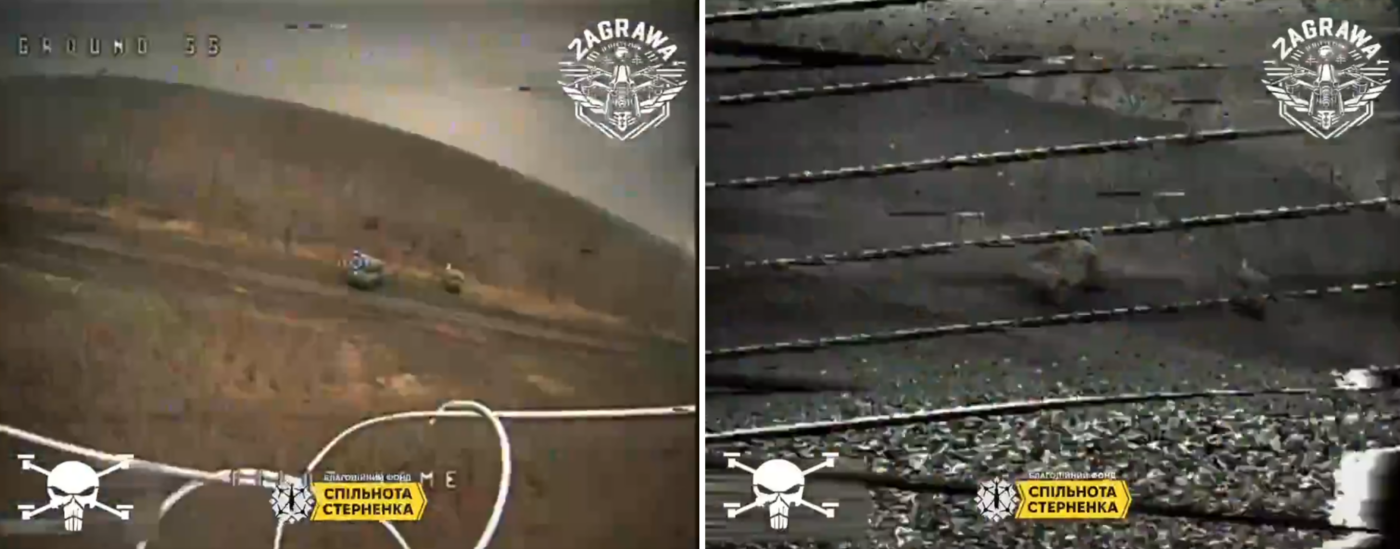
A Russian fiber-optic FPV drone that failed to detonate seen through the camera of a follow-on attack drone – Source BOBRMORF, Telegram
Case Study 2 – Contested Environment*
In a contested environment against a near-peer or peer opponent, we can expect both the overall lethality and hit probability to shrink. Obviously, the main cause is the negative effect of adversarial countermeasures, expressed with a lower P_syssurvival , and the passive/active C-UAS protection installed on vehicles, which is reflected through an inferior WLP coefficient. As shown in the tables below, the lethality probability of both the FPV drone and high-end loitering munition drops 62% and 42%, respectively, with almost two FPV quadcopters out of five and one out of three LMs delivering a lethal strike against an armored vehicle retrofitted with C-UAS protections and supported by EW and kinetic C-UAS capabilities.
While this model uses illustrative scores, it still provides a practical tool to appraise the mission success rate of selected strike drones. Planners can integrate this model to estimate the approximate number of strike assets needed and build best, average, and worst-case scenarios in terms of quantitative and qualitative munition requirements.
Testing the Model
It is possible to test the model using Monte-Carlo simulations reproducing two campaigns, one against an inferior opponent without C-UAS capabilities and one against a peer adversary with robust C-UAS capabilities. For this analysis, each campaign involves 1,000 FPV quadcopter attacks and 1,000 loitering munitions attacks against armored vehicle targets.
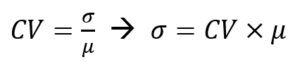
In a simplified modeling, each of the 1,000 FPV drone and LM attacks would have a fixed probability of success (𝑝) – i.e., the two sets of P_lethal calculated for both the FPV and LM using the model above. However, to increase the complexity of the simulation, we can randomize the lethality probability using a coefficient of variation (CV) in a beta-binomial distribution,[2] a probabilistic model that represents repeated trials where the success probability is uncertain rather than fixed. This reproduces the shifts in the FPV drone’s and LM’s lethality probability and will help us have a base understanding of the lethality distribution and the unpredictability of a single campaign outcome in both scenarios.
In both simulations, the CV used for the FPV quadcopter is higher than the CV for the LM, to reflect the (typically) inferior level of standardization and reliability of the former compared to a military-grade weapon. However, evidence from Ukraine suggests that the assumptions regarding the reliability differences between FPV drones and Western LMs require continuous re-evaluation, especially in light of performance issues for Western systems and the growing availability of military-grade FPV drones.
The Monte-Carlo simulations are run through statistical software[3] and the outcomes are shown below:
Uncontested Scenario Simulation
Peer Adversary Simulation
Observations
In both scenarios, the simulations show a wider dispersion for the FPV drone’s lethality distribution, reflecting the system’s higher sensitivity to operational factors and its higher variability across a single campaign. On the other hand, the LM’s tight and steep clustering indicates stronger predictability and supports greater planning confidence.
In a favorable campaign against an inferior opponent, the attacker would achieve ~566 lethal FPV drone strikes and ~843 lethal LM strikes. Unfavorable conditions would result in ~433 successful FPV strikes and 774 LM attacks. In a campaign against a peer adversary, a favorable outcome would result in ~244 successful FPV strikes and ~507 LM attacks. Low success would correspond to ~140 FPV drone and ~430 LM successful attacks.
Deriving Potential Campaign Costs and Magazine Requirements
The difference in reliability and effectiveness between the FPV drone and LM entails markedly different costs. This difference will eventually be just one of the key factors in selection criteria, along with many others such as doctrine, operational conditions, sustainment, risk tolerance, and more. To estimate the potential costs of a drone strike campaign, planners must first answer two questions: what is the minimum number of successful strikes required to achieve the operation’s goals, and how many attacks are necessary to attain it?
In a real situation, the minimum acceptable number of successful strikes is estimated based on specific operational objectives, the expected role of the munition within the wider set of fire support capabilities, and available intelligence on the enemy forces’ strength, position, and equipment. The second element depends on the platform’s known (or expected) lethality but also the associated concept(s) of employment (CONEMP), sortie generation, and logistical capacity of blue forces (factors which are beyond the scope of this analysis). These factors add to the per-unit cost of the system in question.
For this analysis, we establish 450 vehicles destroyed/disabled as the minimum viable amount – expressed as K_min – in a drone strike campaign supporting a brigade-level operation against a peer adversary. The scenario assumes that the munition – alongside platoons’ and companies’ mortars – would provide the bulk of tactical fire support beyond the line of sight, with a focus on counter-mobility and heavy armor targets. Adversarial anti-access/area denial systems and other threats would limit both indirect artillery fire and tactical air support.
To obtain the number of potentially required attacks, we use the following formula:
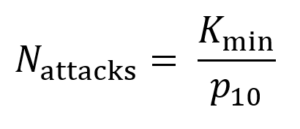
The p_10 value denotes the 10th percentile of a probabilistic distribution, or – in this case – the lethality of the munition in the worst 10% of plausible occurrences. The p_10 can be used as a conservative planning value representing a low success but still possible outcome, influenced by uncertainties in system performance, operational conditions, and countermeasures typical of contested environments. In a Beta-binomial distribution with shape parameters α and β (previously computed for the simulation against a peer adversary),[4] the p_10 is derived with the inverse cumulative distribution function (CDF) F^-1 (p), or p_10=F^-1(0.10) . We compute it for the FPV drone and LM using a statistical software[5] with the script “beta.ppf(p, α, β)”, as follows:
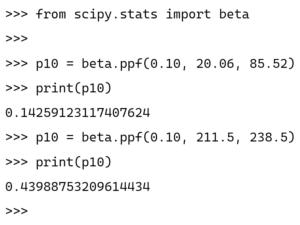
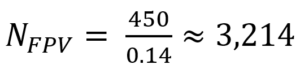
The FPV drone approximate lethality at p_10 is 0.14 (down ~26% from its mean) and the LM approximate p_10 is 0.44 (down ~6% from its mean). Therefore, we obtain that if systems’ lethality falls to a low (yet plausible) level, the number of FPV drone attacks necessary to destroy or impair 450 armored vehicles would be:
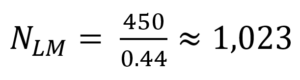
while the required amount of loitering munition attacks would be:
Planners would likely rely on these conservative estimates and plan for a higher number of attacks to ensure they can meet the campaign objective with high confidence, even if per-attack lethality drops. However, the p_10 conservative quantities are not a prediction of actual usage. Obviously, there is a higher probability of achieving greater lethality, requiring fewer attacks.
Assuming a flyaway unit-cost of €1,000(~$1,200) and €35,000(~$41,000) for the FPV and LM respectively, the resulting budgets (B) for the conservative scenario with lower-than-expected lethality would be B_FPV ≈ €3.21M($3.76M) and B_LM ≈ €35.8M($41.9M). Importantly, this estimate does not include logistical and associated operational costs and underscores a significant cost gap between the two systems.
However, as previously explained, cost is only one of the variables at play and not necessarily the decisive one. For example, a force operating in a high tempo environment characterized by contested logistical lines and dispersed formations – e.g., a U.S. Marine Corps infantry battalion in a remote island in the Indo-Pacific, or a contingent of U.K. Royal Marines supporting amphibious operations in the High North – would favor a solution that requires a low cognitive burden and guarantees a high sortie rate as well as greater lethality per weight despite higher costs in order to maximize the probability of success and reduce logistical requirements. Conversely, a force that controls its interior lines of communication and benefits from robust logistical support across time and space may opt for a cheaper FPV drone-type of capability for its tactical precision fire support needs, with mass (enabled by steady resupply) compensating for inferior lethality. This is currently the case in Ukraine.
Limitations and Future Prospects
This analysis has several important limitations that should be clearly acknowledged, as they shape both the interpretation of the results and the extent to which the model can be generalized beyond the cases examined:
- The parameterization of the model relies predominantly on open-source intelligence (OSINT), including battlefield reporting, interviews, imagery, and secondary sources. This introduces inherent challenges related to data fidelity, completeness, and bias. As a result, the probability values assigned to each phase of the kill chain are illustrative and should be understood as informed estimates rather than precise measurements. This affects confidence margins around the numerical outputs.
- The simulations employ a largely static representation of adversarial countermeasures that favor analytical tractability. Electronic warfare intensity and kinetic C-UAS effectiveness are treated as bounded probabilistic inputs rather than as fully dynamic, co-evolving processes. In reality, countermeasures and strike tactics interact continuously, with learning effects, rapid adaptation, and localized asymmetries that can significantly alter lethality over time.
- The model is scoped to tactical strike drones employed against armored vehicle targets and does not analyze effects related to other weapon systems or target sets, nor does it capture higher-level operational integration, combined arms synergies, or other aspects. These boundaries limit direct extrapolation to other mission sets or strategic contexts.
- The model explores the lethality of a specific class of weapons. However, weapons’ lethality should always be assessed within a broader “lethality framework” that combines organizational, procedural, and social elements (e.g., adaptation strategies, human performance, resiliency – or lack thereof – etc.).
Future work should aim to validate and refine the input parameters through controlled testing, structured field experiments, or access to classified operational data. Such efforts would strengthen the empirical grounding of the model and improve its robustness across a wider range of operational environments.
Conclusion
This analysis unpacked the complex nature of small strike drones’ lethality and shown how this metric depends on the interaction of multiple variables, including the system’s technical reliability, its ability to resist or evade adversarial countermeasures, the operator’s skills, the terminal accuracy, and the warhead’s performance.
By formalizing tactical drones’ lethality as a multi-stage probabilistic kill chain rather than a single performance metric, the proposed model helps move the debate beyond simplistic cost-per-unit comparisons. The results highlight that mass alone can compensate for limited effectiveness only under specific operational conditions, notably permissive logistics, high operator availability, and high sortie generation capacity. Conversely, in contested environments characterized by dispersed operations and constrained sustainment, performance predictability and high system effectiveness become decisive advantages.
Annex
Methodological Details
Breakdown of the Lethality equation’s factors:
The model further breaks down P_damage|hit to quantify the different results caused by hits in distinct areas of the vehicle, because the effectiveness of a hit is highly dependent on the impact location, as follows:
Where:

For this analysis, we have considered the roof, rear, sides, and front as the target areas most conducive to mission kill. The following table presents the FPV and LM hit probability scores specifically for each of these critical impact zones:
Calculation of α and β parameters:
The specific α and β values for the FPV drone and LM (related only to the peer adversary scenario) are computed through the standard Mean (μ) and Variance (σ^2) formulas:
We isolate α and β as well as using the mean (μ) definition:
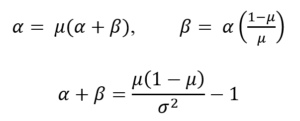
Then, using the mean (μ) and CV to derive for the FPV drone and LM, as follows:
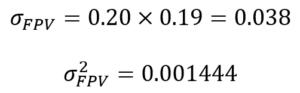
FPV drone:
LM:
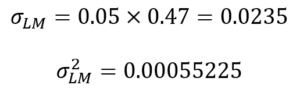
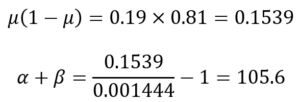
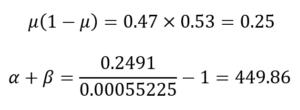
Since α+β=(μ(1-μ)/σ^2)-1 where μ_FPV=0.19 and μ_LM=0.47, we compute α+β:
FPV drone:
LM:
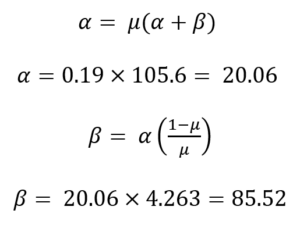
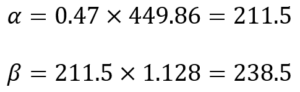
We substitute into α and β formulas:
FPV:
LM:
[1] It is possible to distribute the countermeasures across both the transit and engagement phases for more complex modeling, though this requires strict conditional independence to avoid double-counting. Furthermore, it is also possible to modify the inputs of each factor according to the target/mission set.
[2] The beta-binomial distribution models the number of successes in n independent Bernoulli trials. It is an extension of the binomial distribution for cases where the probability of success in each trial is not fixed, as it is in the binomial model, but is a random variable following a beta distribution with shape parameters α and β. See the Annex for the detailed calculations. See also Rodrigo Morales, The beta-binomial model: an introduction to Bayesian statistics, Medium, August 13, 2022, https://medium.com/@romoflow/the-beta-binomial-model-an-introduction-to-bayesian-statistics-154395875f93.
[3] The author used Python 3.14.
[4] The Beta parameters describe how often success and failure are expected to occur: 𝛼 reflects the weight of successful outcomes, β the weight of unsuccessful ones, and their balance determines both the average effectiveness and how consistent it is across campaigns. See the Annex.
[5] For this analysis, the author used SciPy on Python 3.14.